Bridgestone approached our team to evaluate and improve its tire health management (THM) tools for multi-scaled fleet operations. The existing experience was split across three platforms with inconsistent UI, unclear tire health scores, and no mobile-optimized support for service reps in the field.
Role:
Product Manager, UX Designer
Industry:
Automotive Tires
Duration:
October 2024 - May 25
Discovery
While no one in the team had previous experience with mechanics, fleets, or just car-related knowledge- corporate has given us the task to answer these questions:
Who are the actual users of Bridgestone’s tire health tools — and what are their roles and needs?
→ Bridgestone wasn't entirely sure which personas were using their tools day to day, so our first goal was mapping the user landscape.How do these users navigate the current platforms, and where do they get stuck?
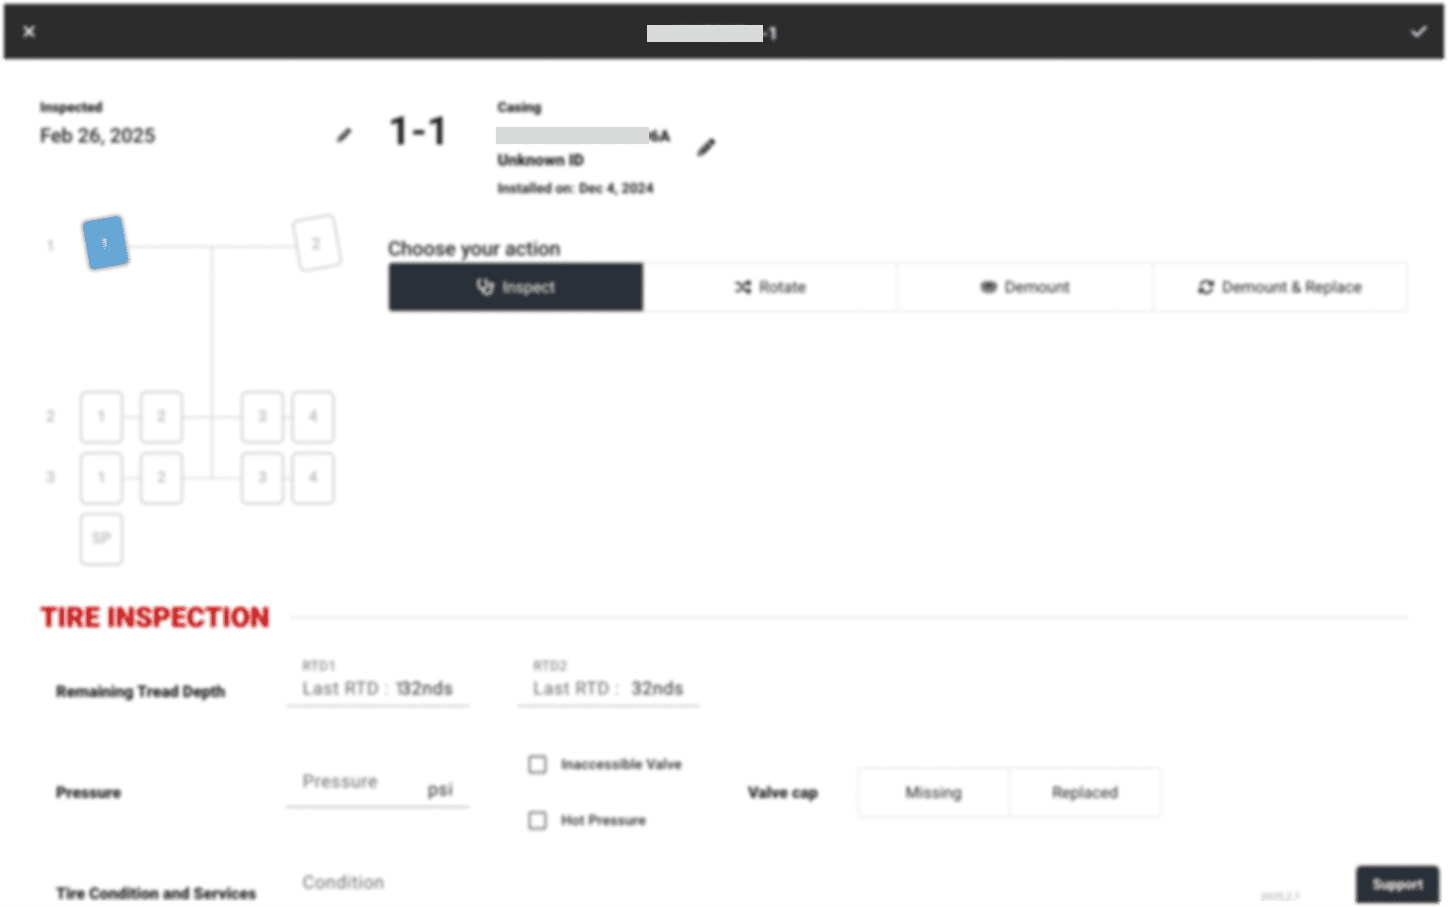
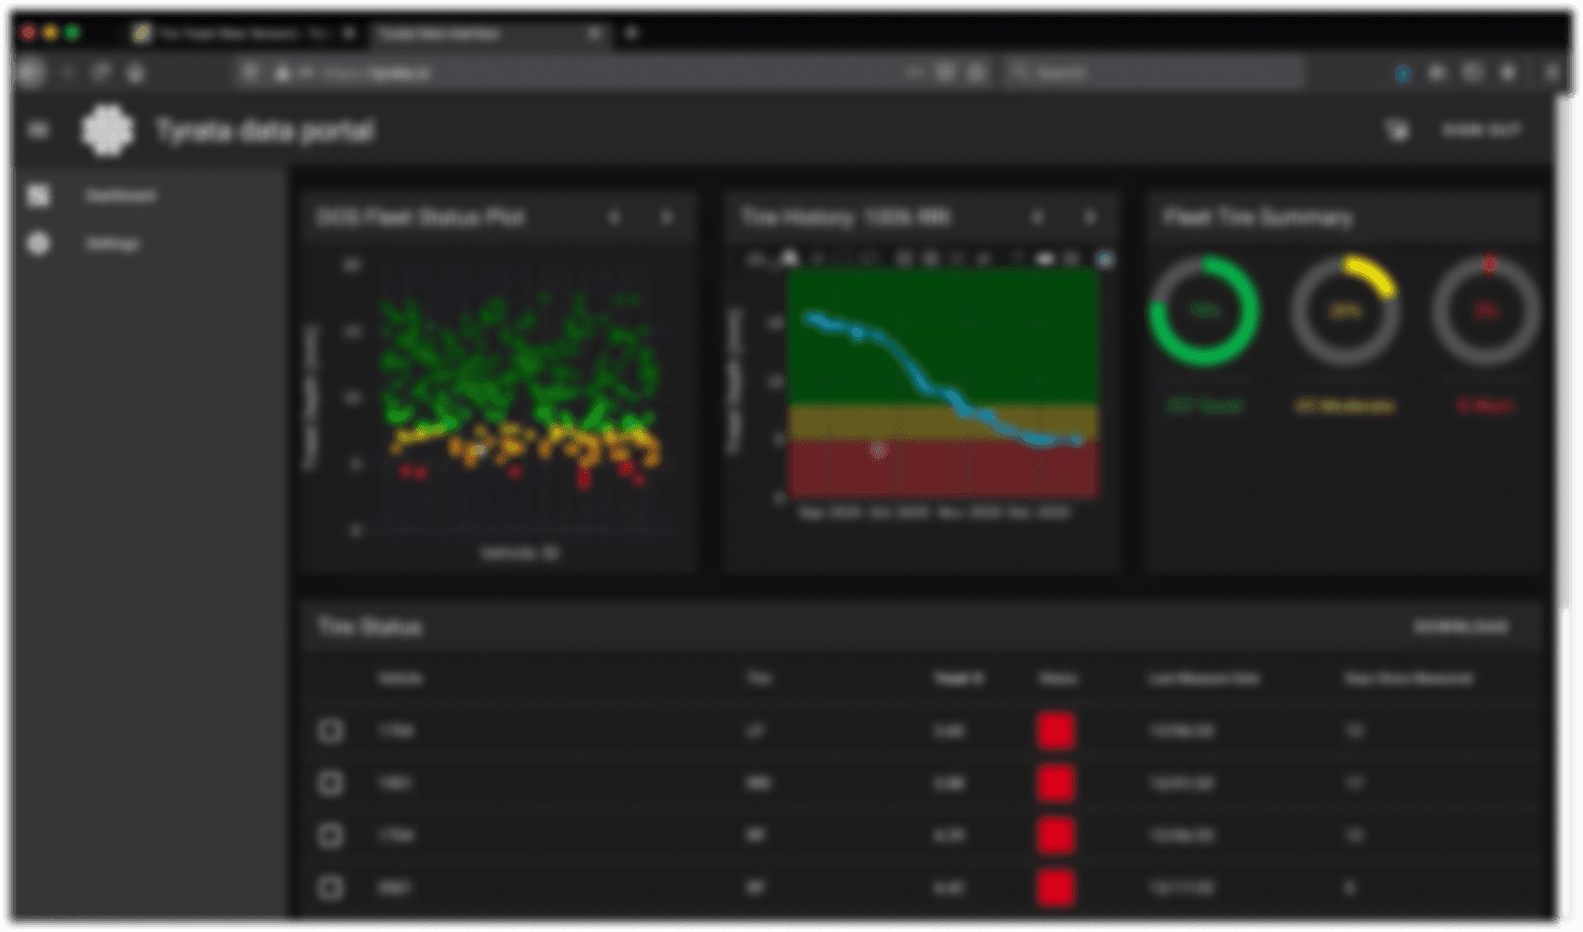
→ We needed to identify usability issues across disjointed systems like Toolbox, Tyrata, and Geotabs.What data do users actually need — and how do they use it to make decisions?
→ We explored what metrics mattered, how users prioritized them, and how overwhelmed they felt by irrelevant information.How can we make notifications and alerts clearer, more actionable, and less overwhelming?
→ Many users felt buried under noisy alerts. We wanted to help them focus on what truly matters.
Do different personas have different needs that aren't related to the other?
User Research
To understand the problem space, we conducted:
10+ interviews with fleet managers, technicians, and Bridgestone stakeholders
Contextual inquiries and tool walkthroughs
Affinity diagramming to synthesize key pain points
“It’s hard to know what the tire score even means, let alone where to go next.”
— Fleet technician interview
Key Findings
Users face cognitive overload from disjointed tools and cluttered dashboards
"Tire Health Score" is misunderstood and lacks actionable context
Technicians and managers need different data views but currently receive the same layout
Data export and filtering options are minimal, causing manual workarounds
**Note: Images blurred to protect privacy, NDA was signed, please reach out to me for further information.
After intial exploration, we were able to redfine the questions:
How do users currently navigate Bridgestone’s tire health tools, and where do they struggle?
→ To uncover usability gaps across fragmented platforms like Toolbox, Tyrata, and Geotabs.What information do fleet managers and technicians actually need to make decisions?
→ To identify which data points matter most and how they’re interpreted in real-world workflows.How can we improve alerts and notifications so they lead to timely, useful actions?
→ To ensure urgent issues are noticed, understood, and addressed without confusion.What are the biggest barriers to collaboration and data sharing across user roles?
→ To streamline handoffs and reduce friction between managers, technicians, and external partners.
Define
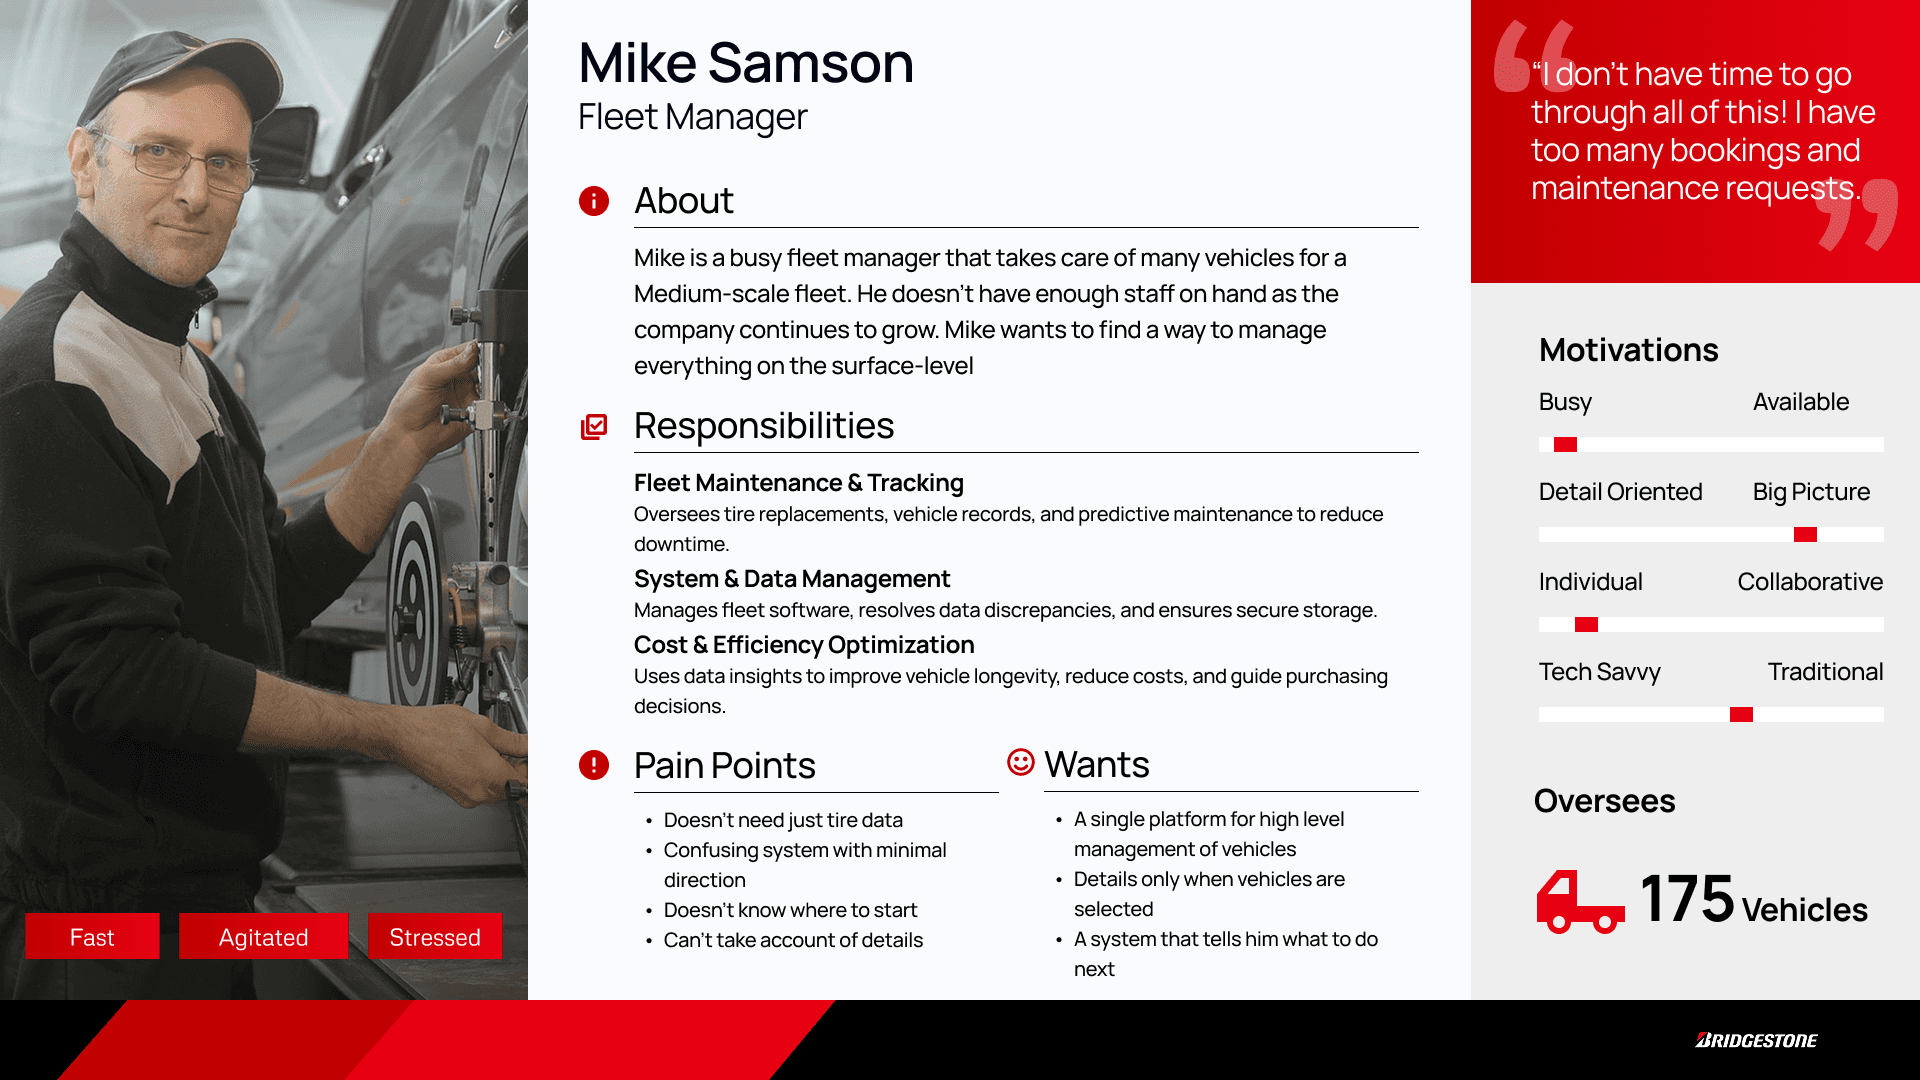
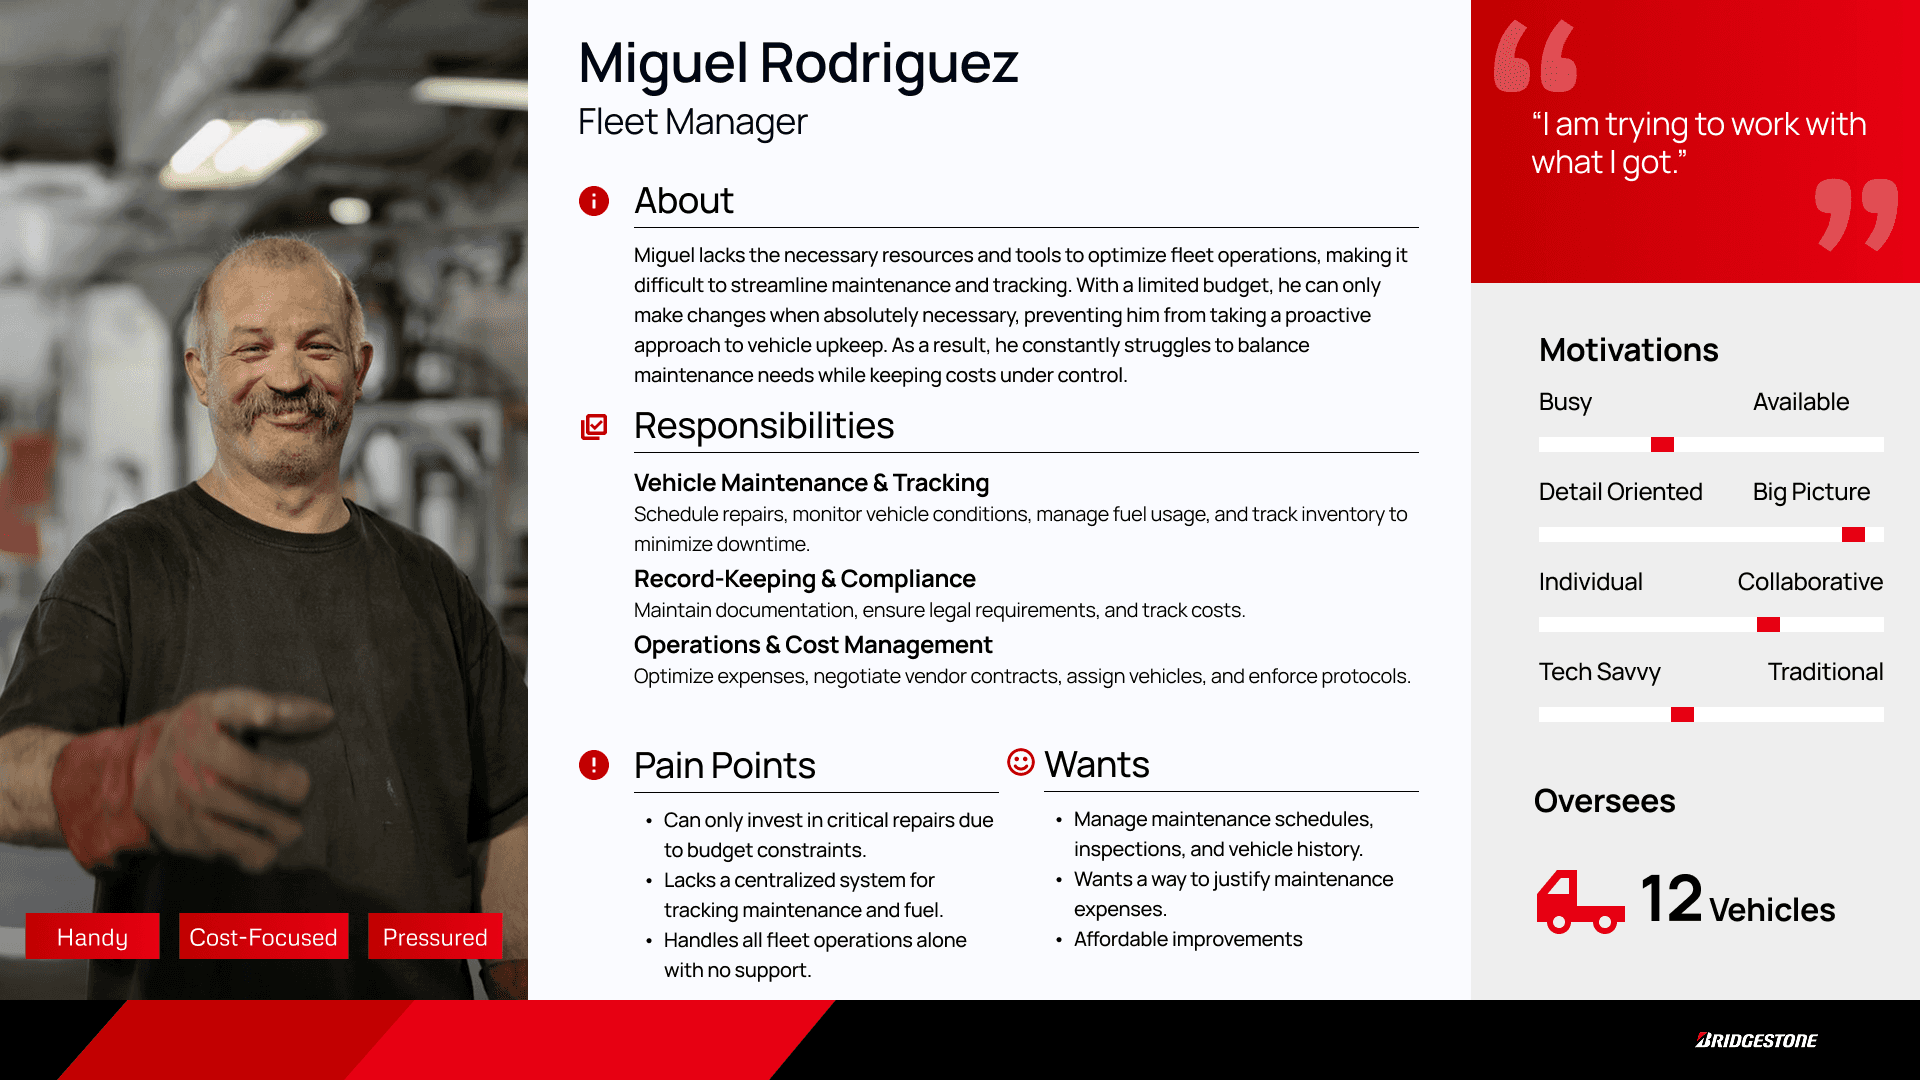
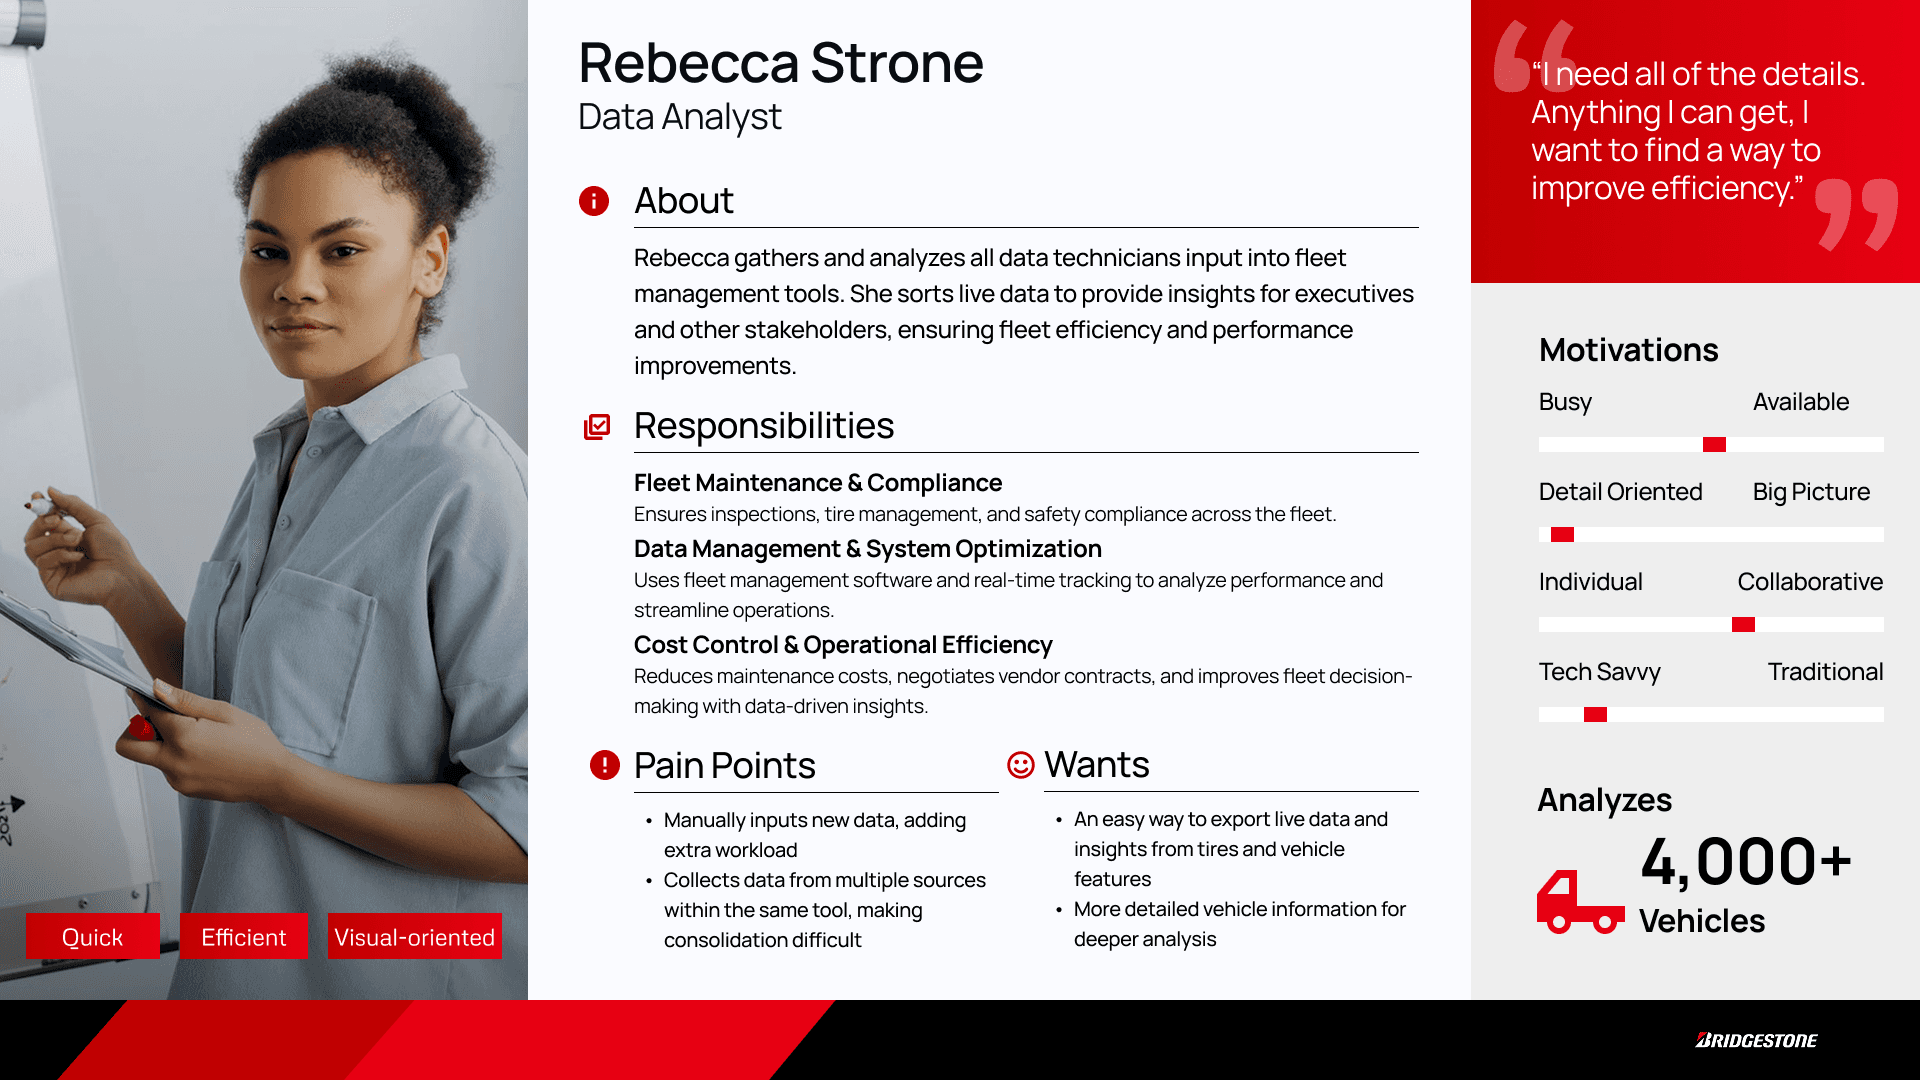
Through our initial findings, we were able to develop 3 Core Personas:
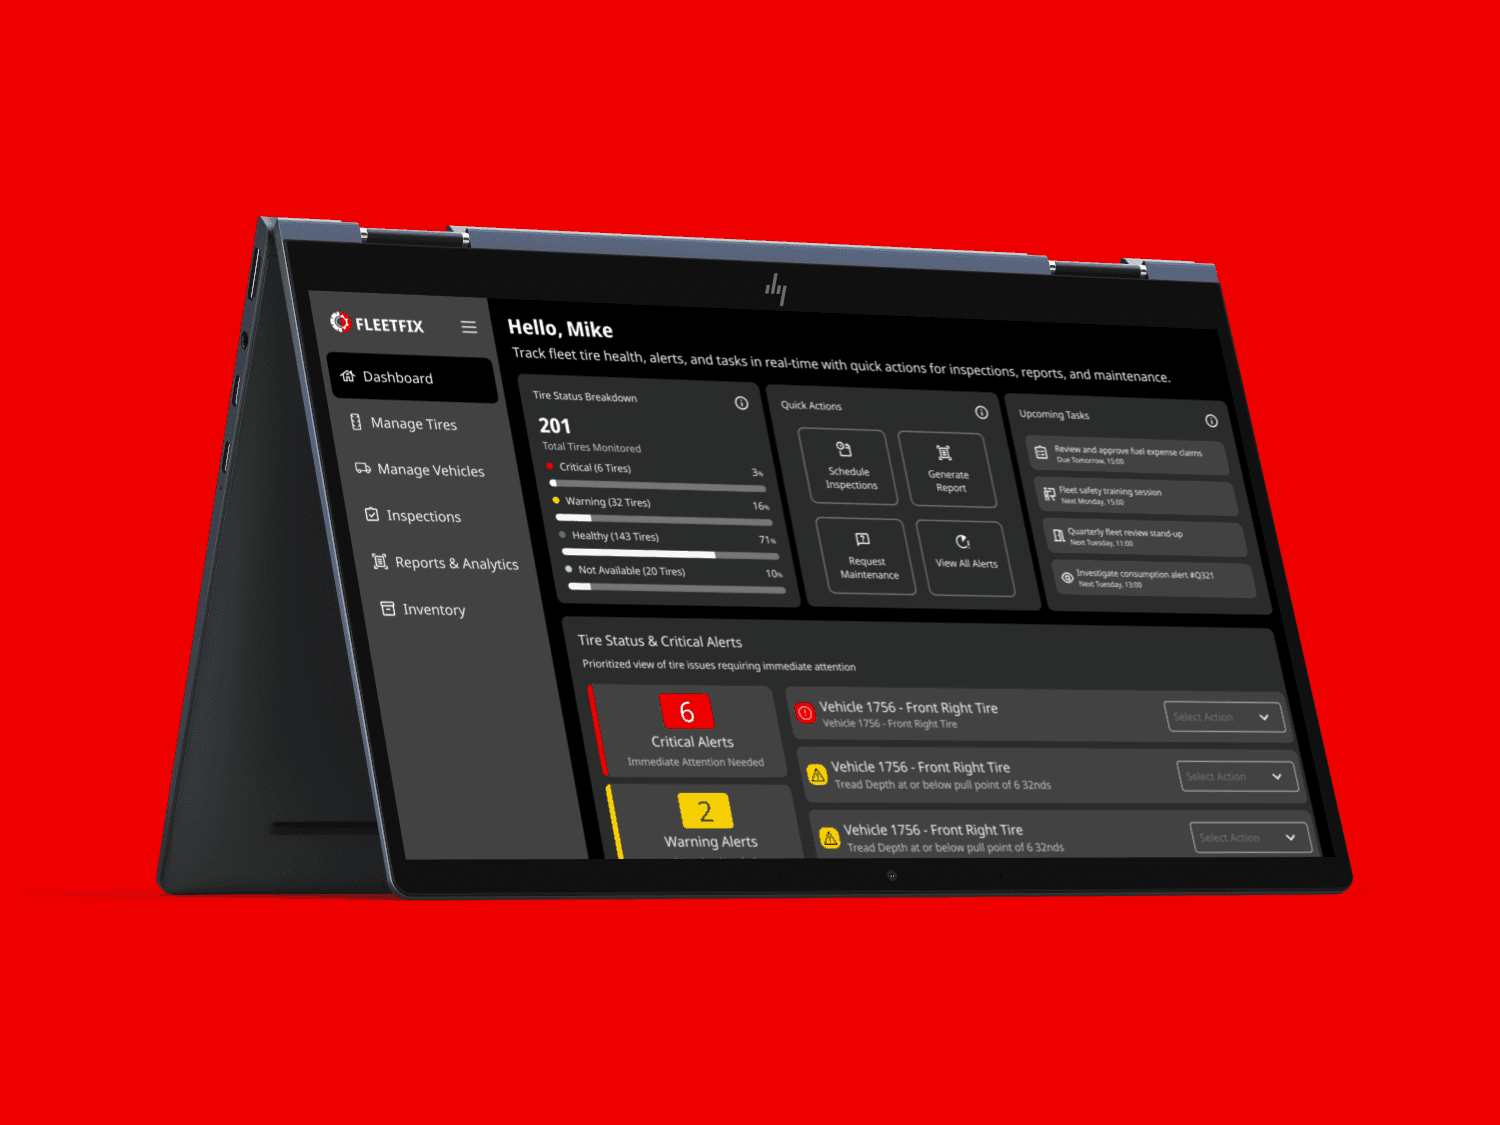
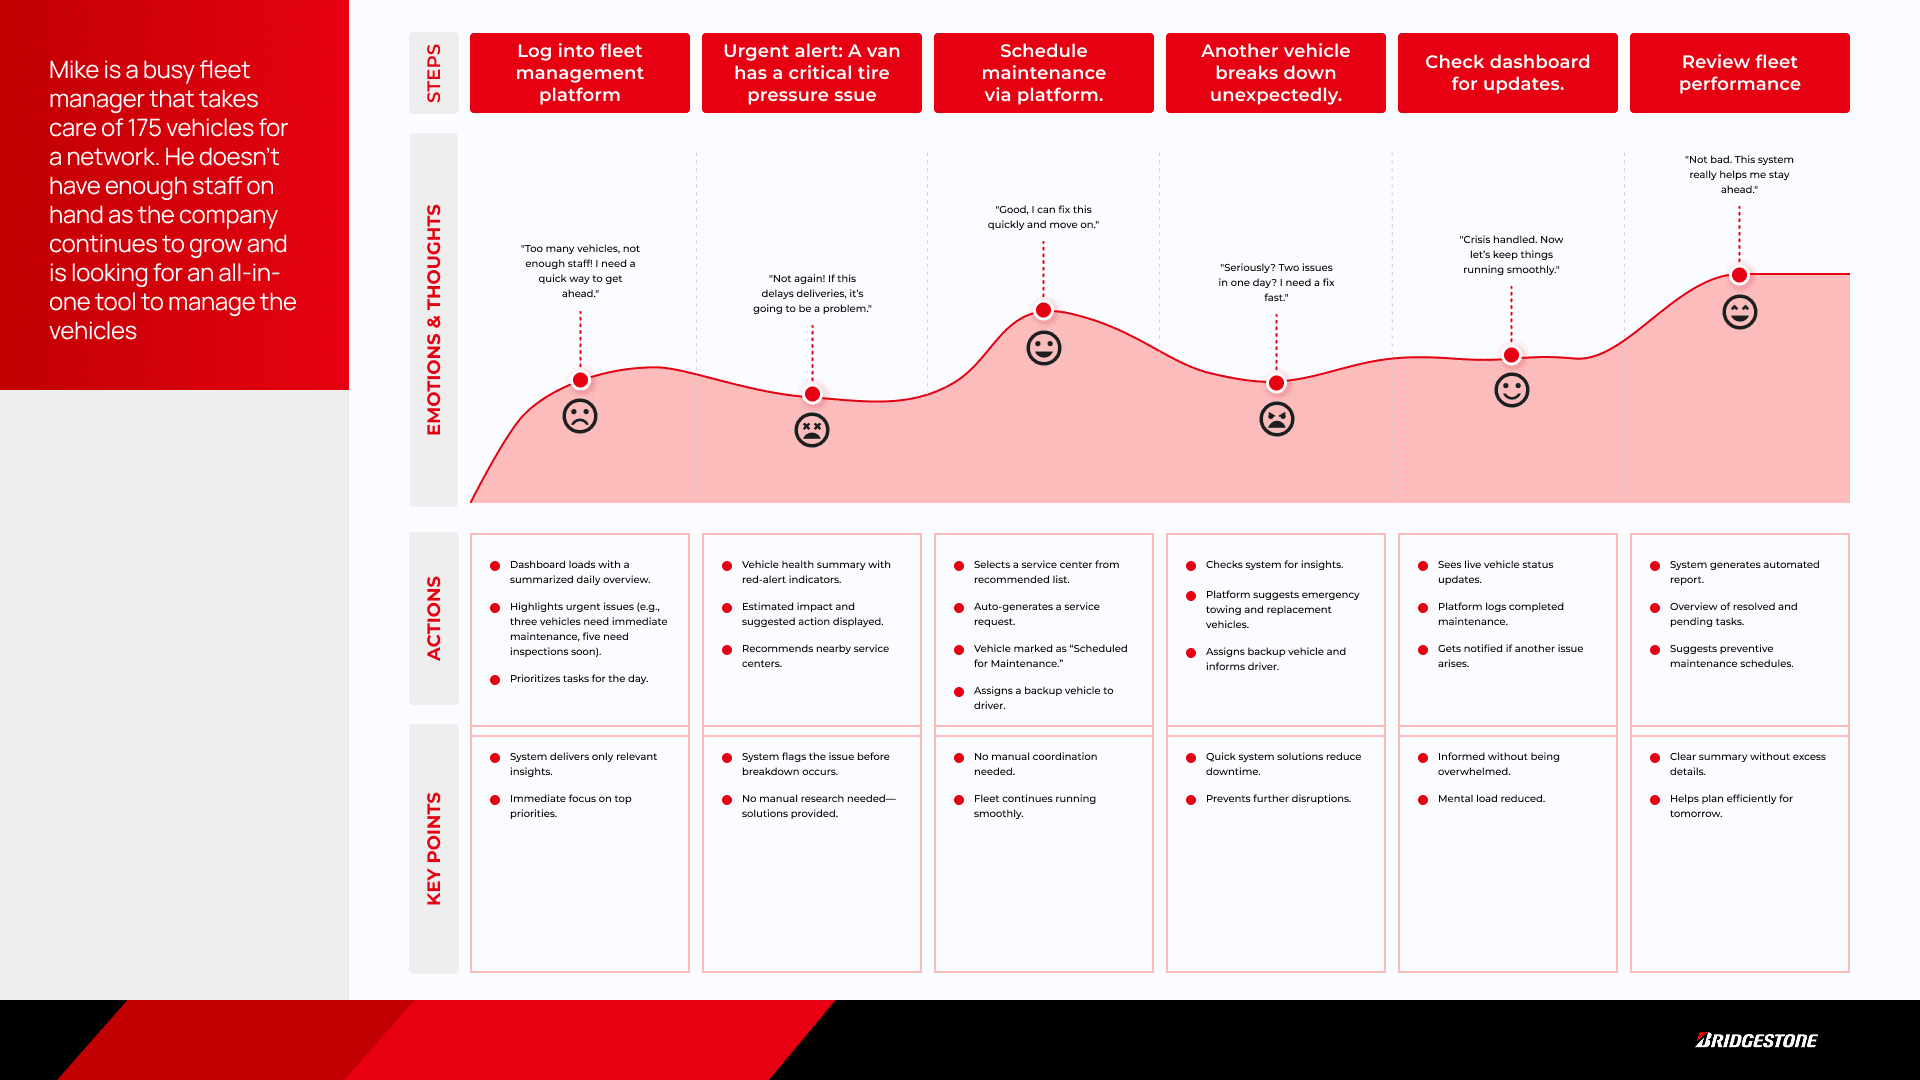
Mike, the Fleet Manager: Needs quick triage, task scheduling, and trust in alerts
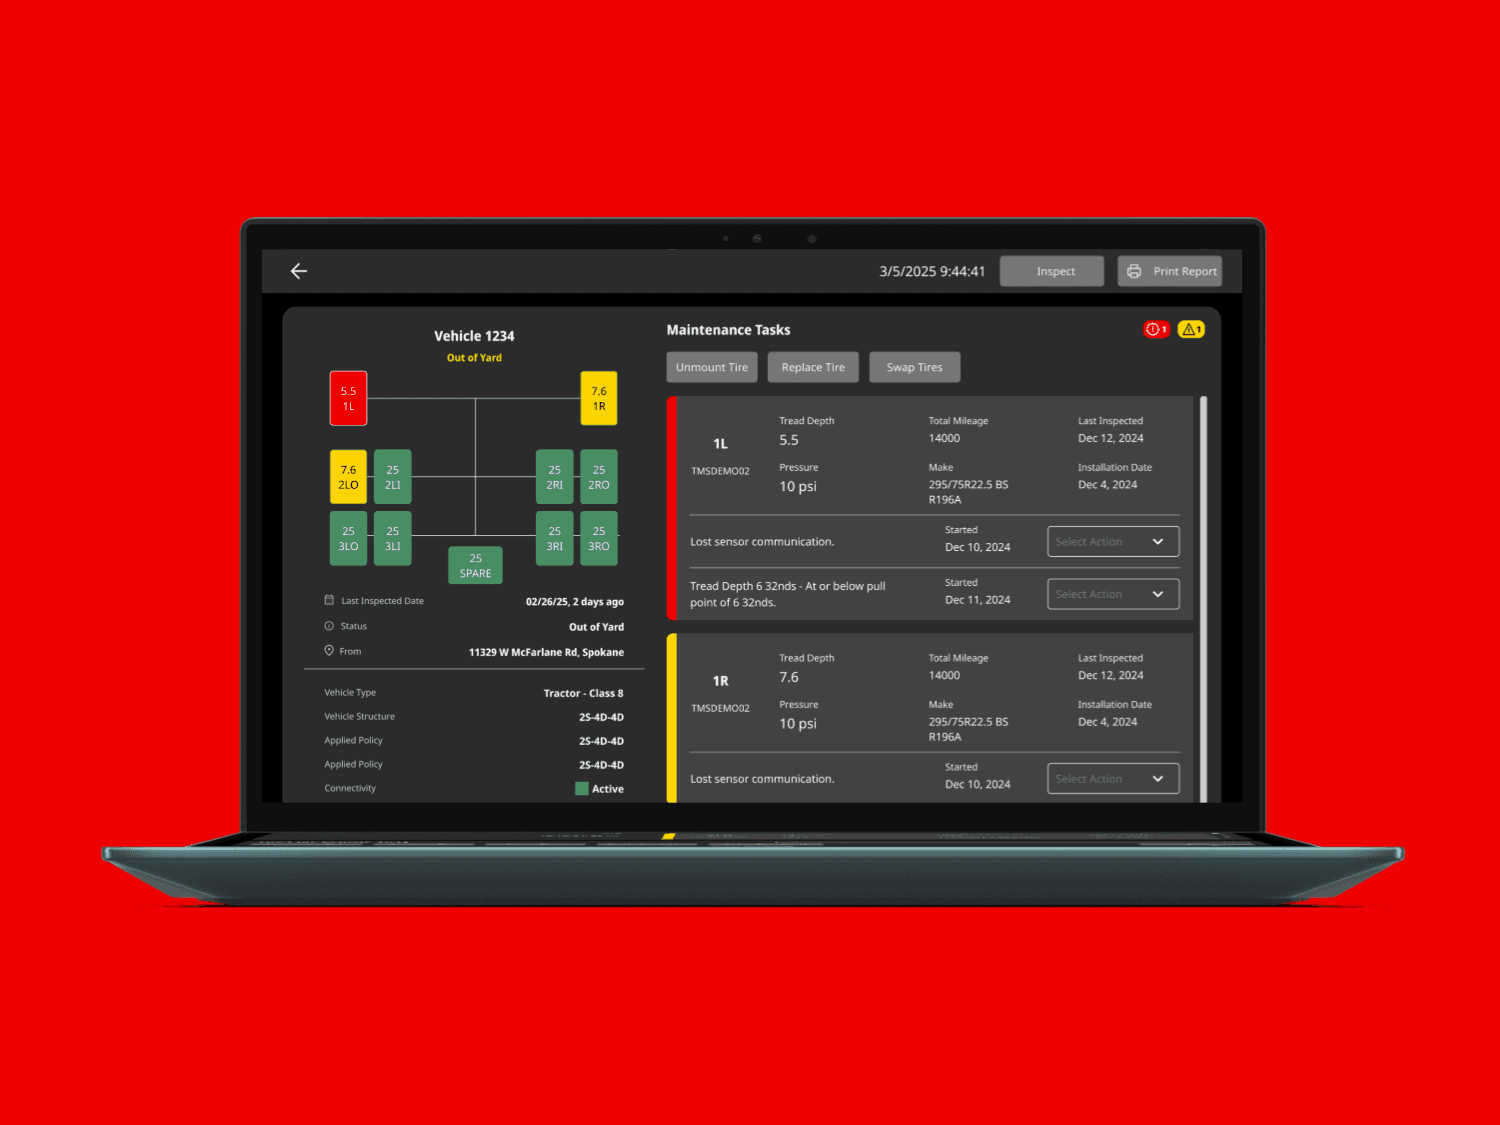
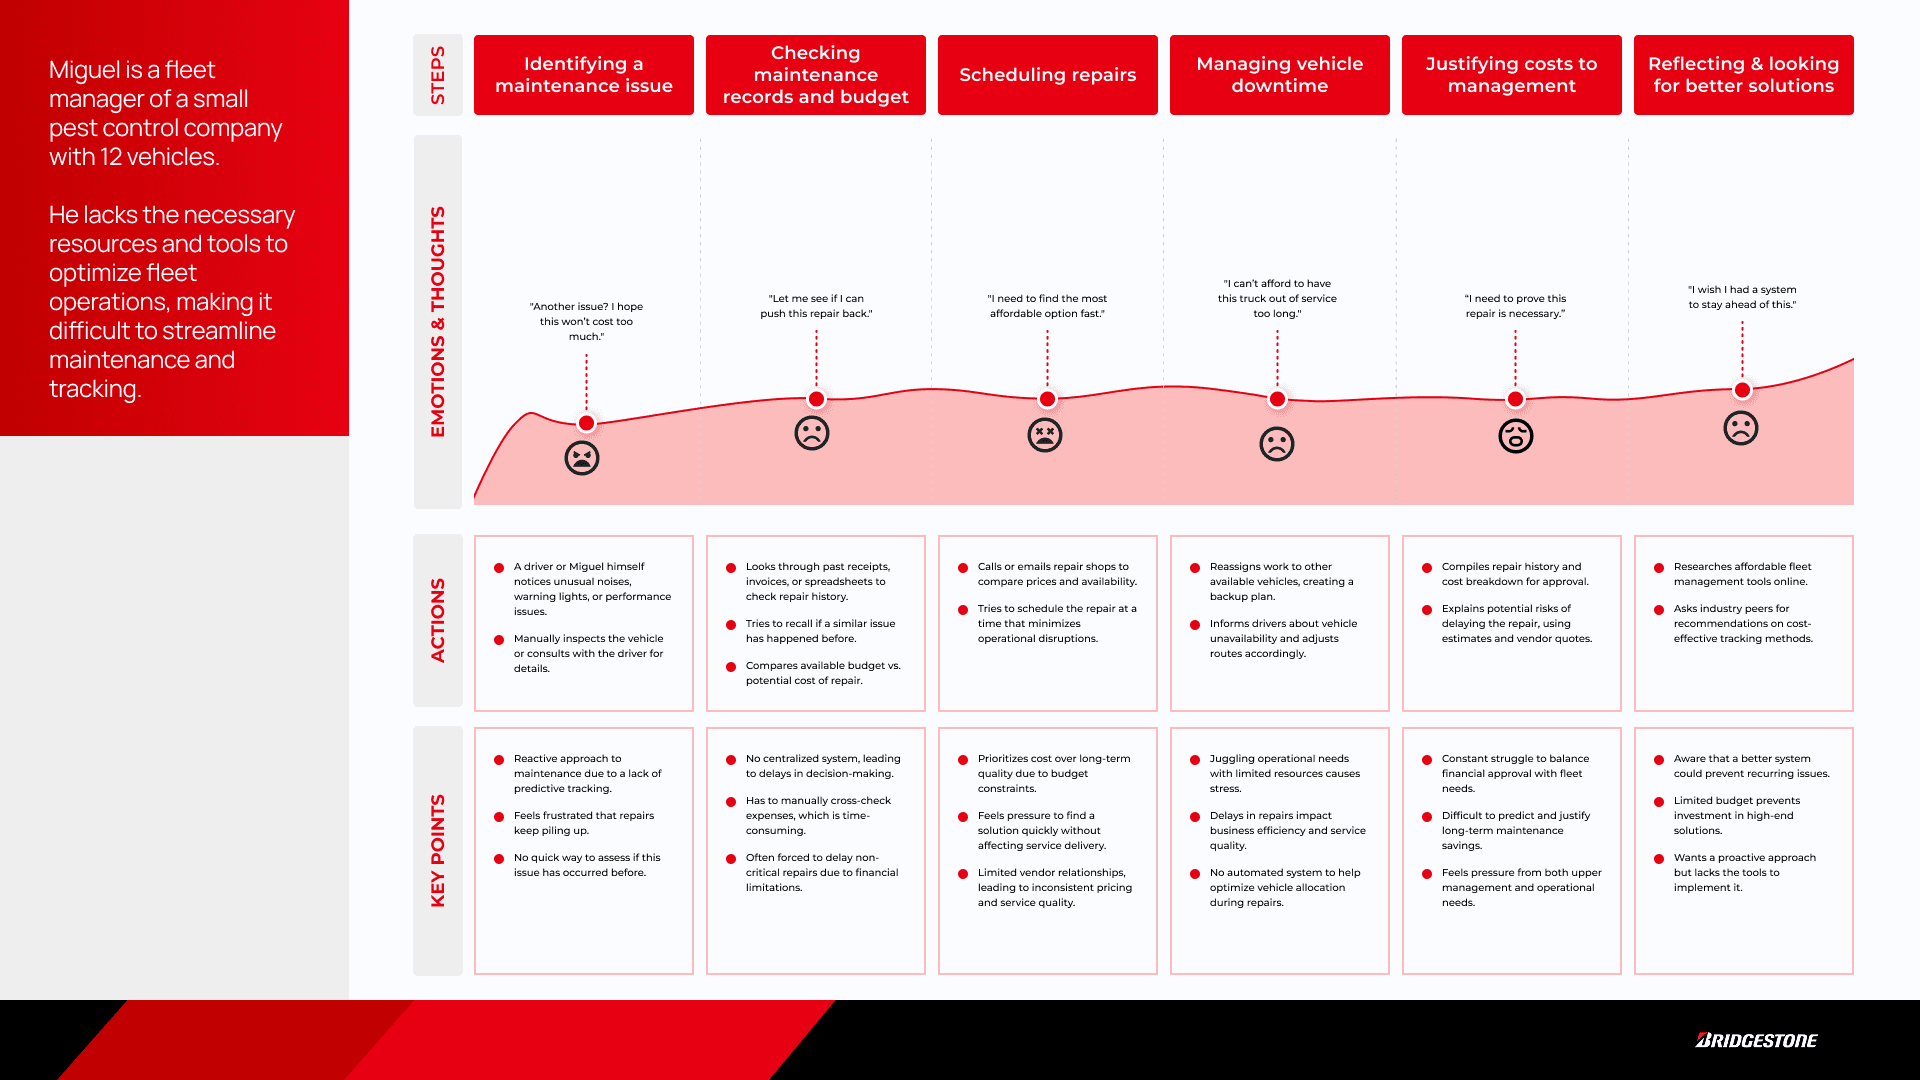
Miguel, the Technician: Needs clear, actionable alerts and mobile usability
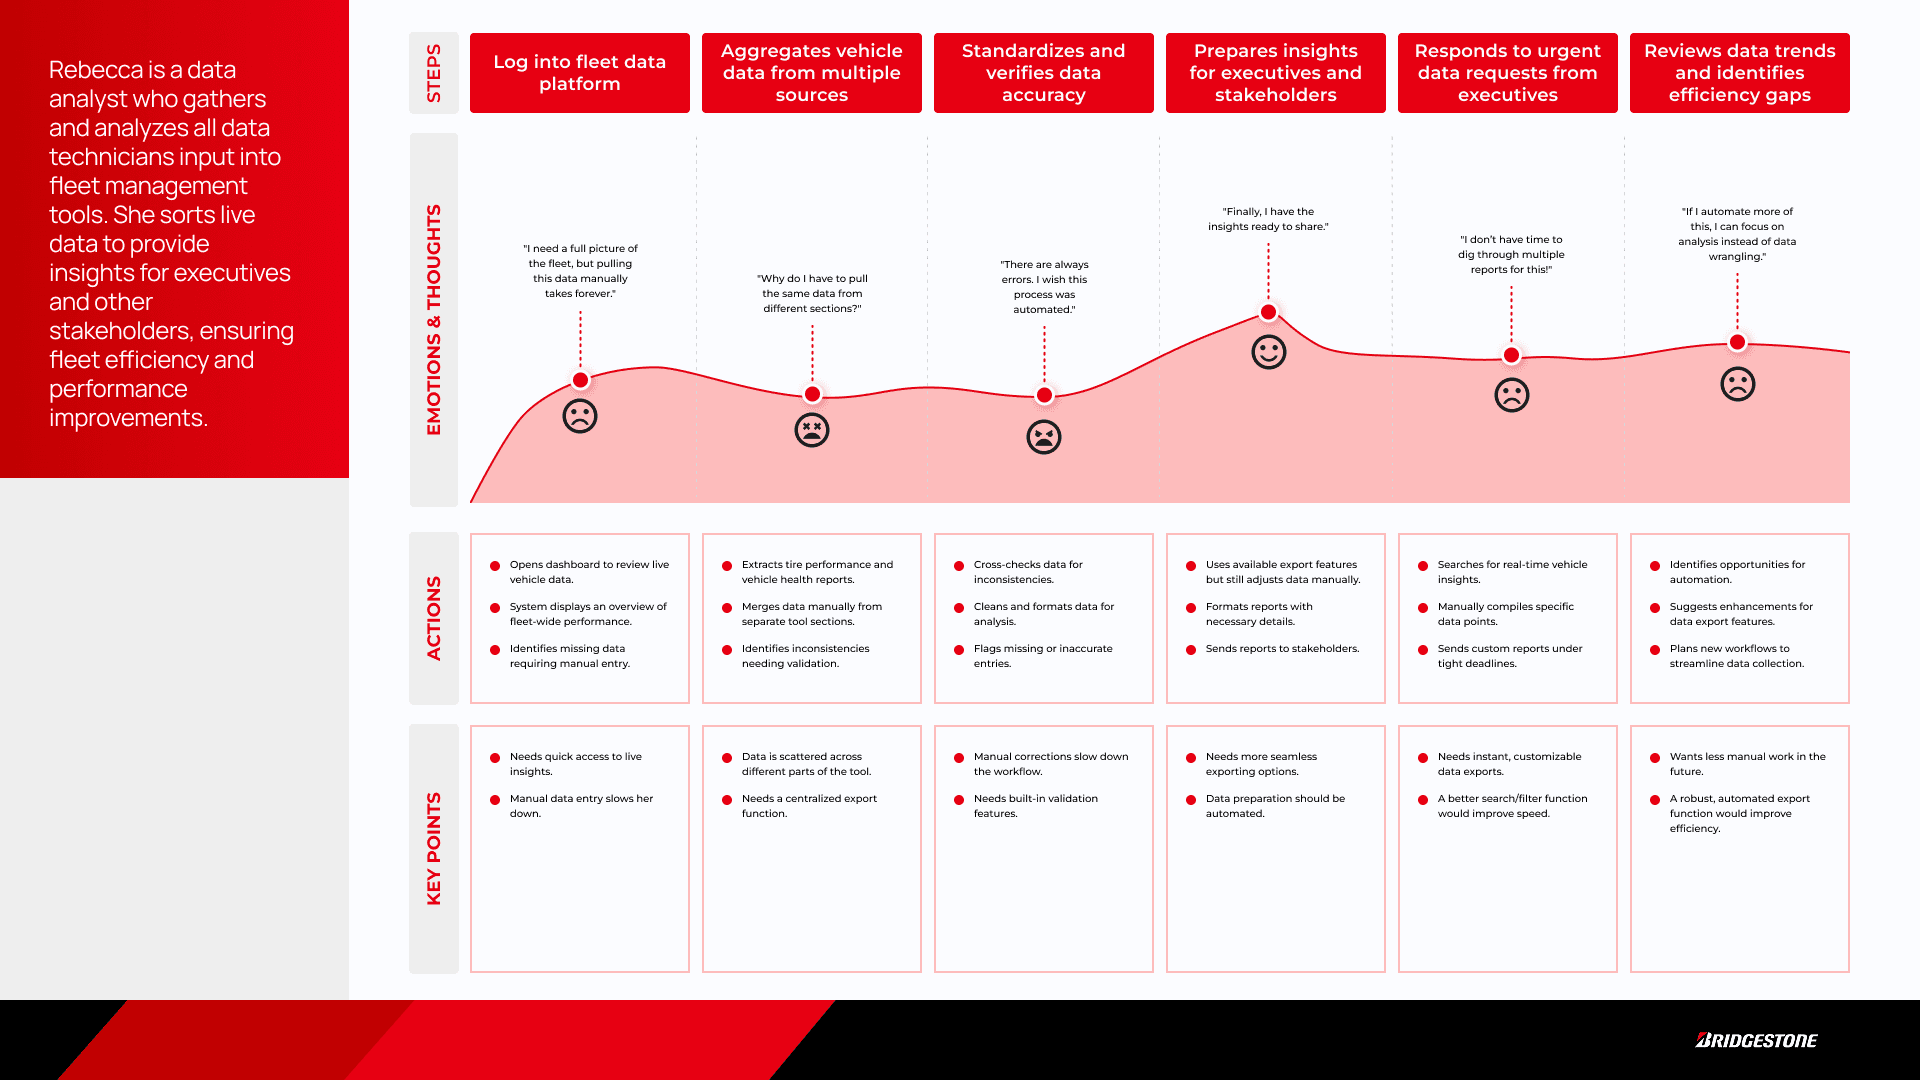
Rebecca, the Data Analyst: Manages behind-the-scenes with data across the entire company
UX and Product Requirements
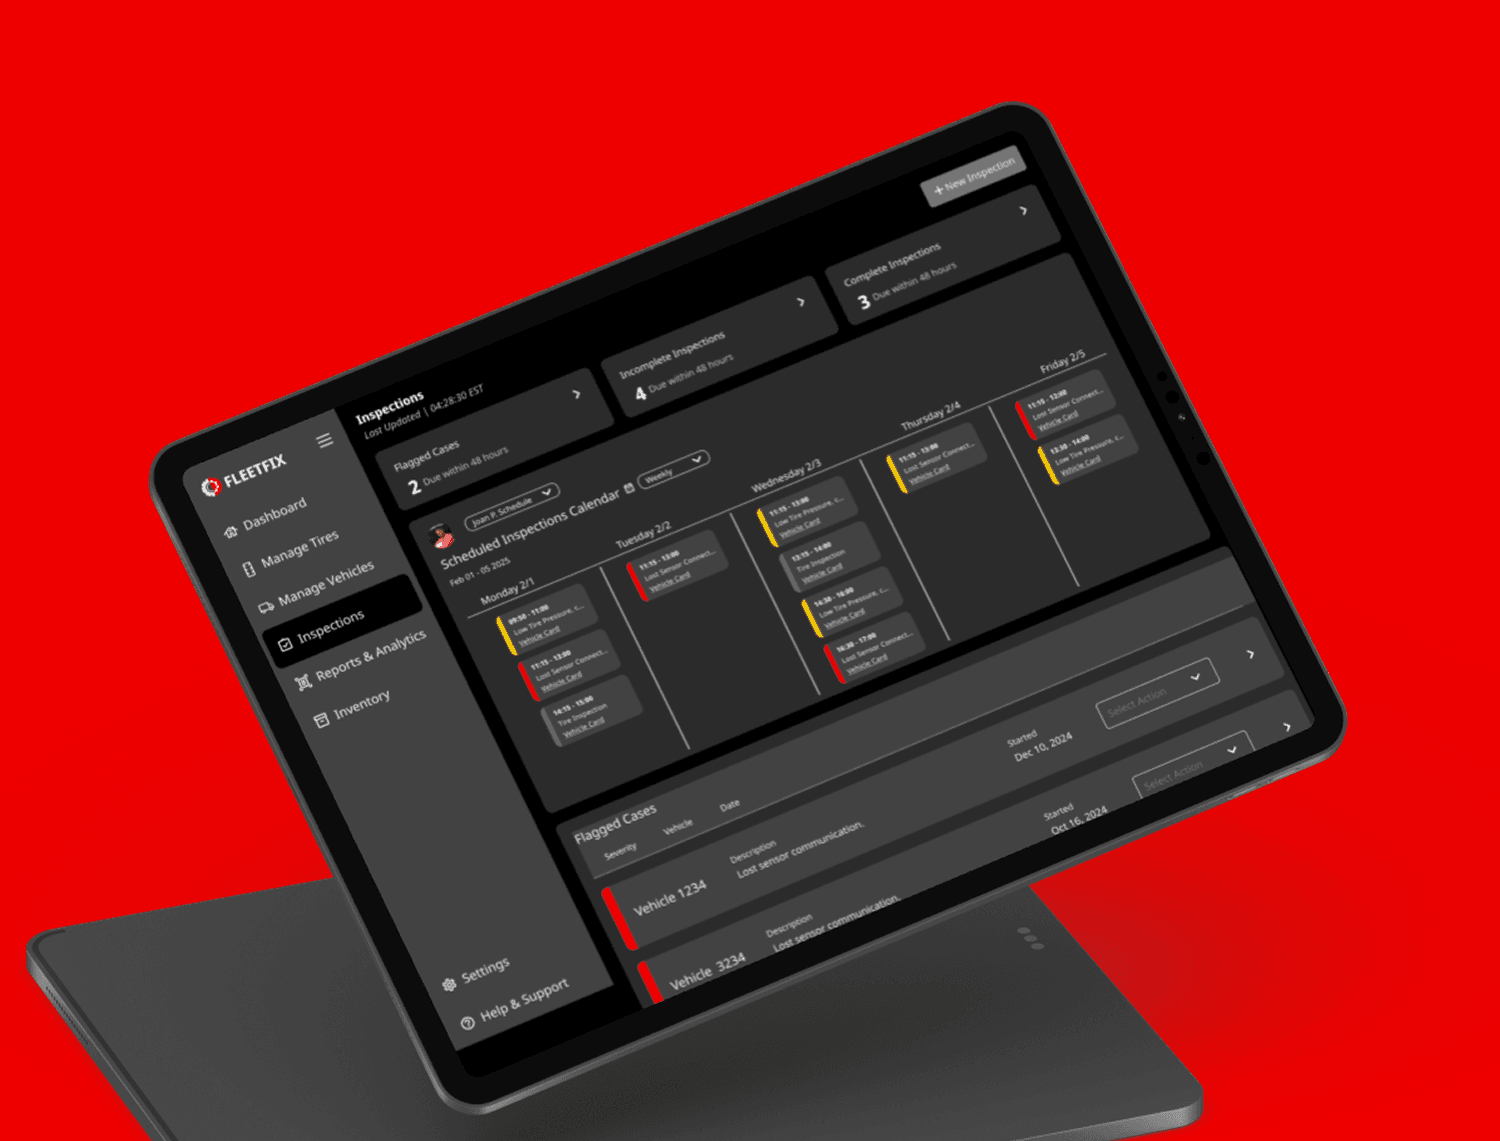
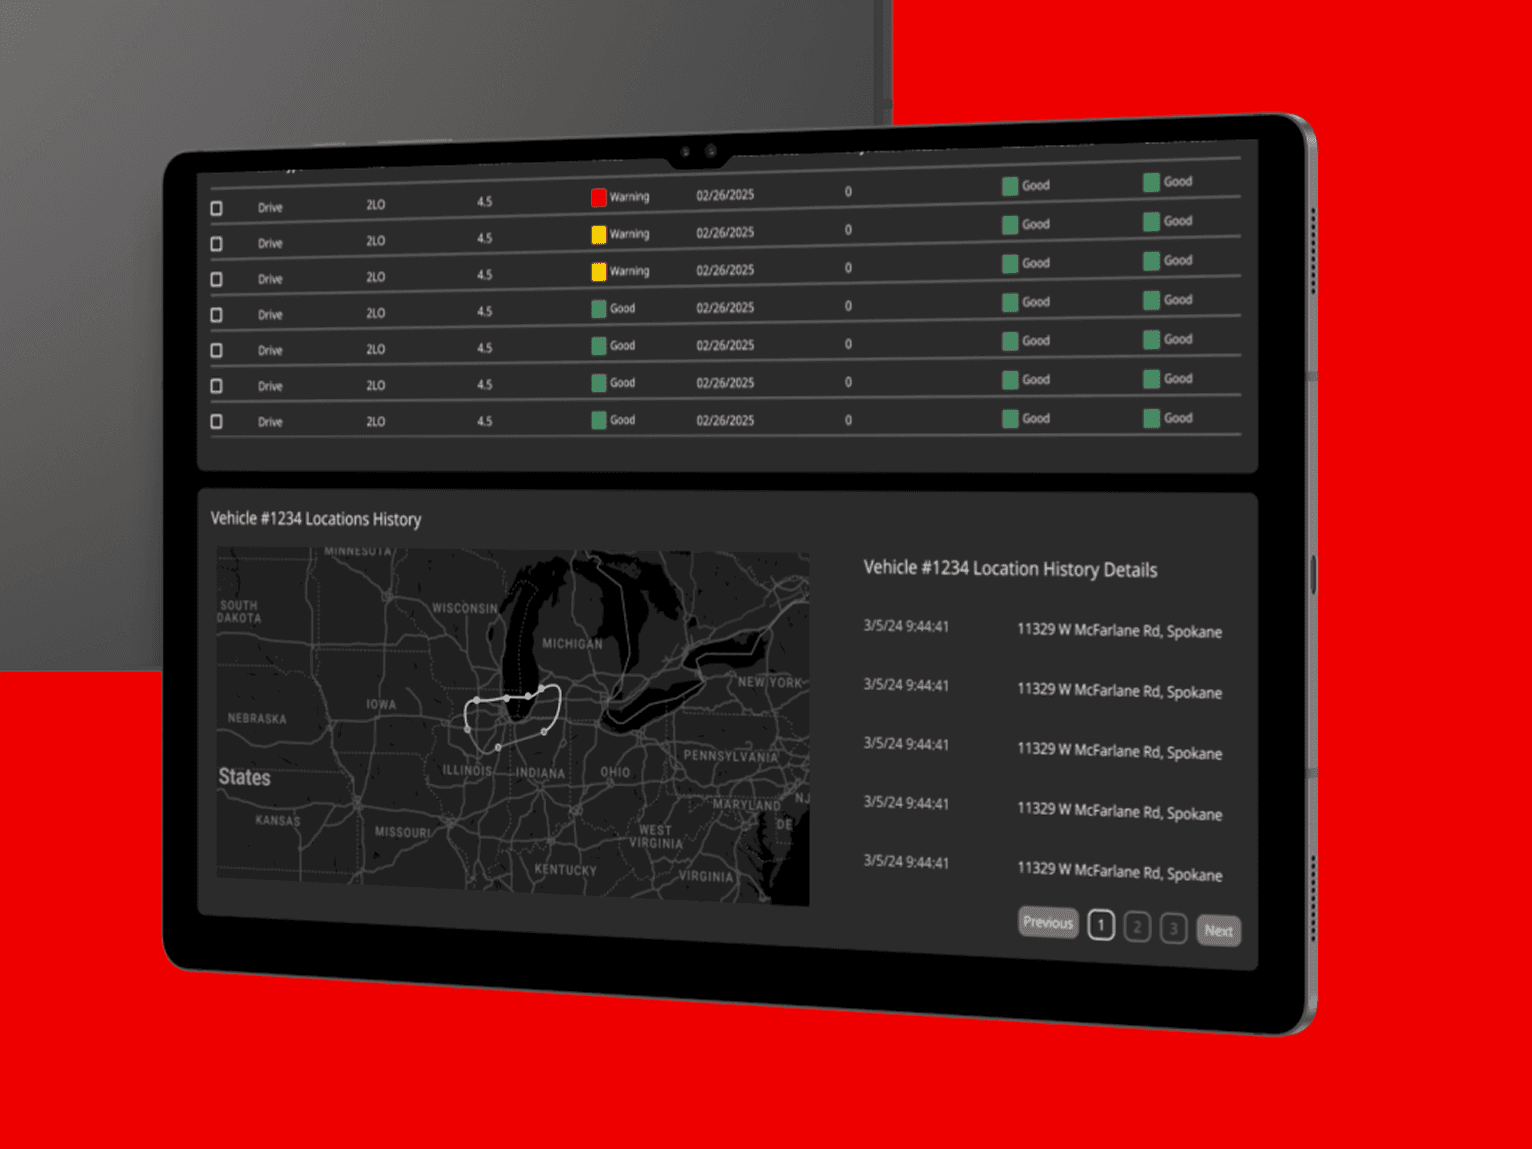
Unified dashboard with real-time status and role-based views
Tiered alert system with red/yellow/green states
Simplified data visualizations (no pie charts!)
Mobile-first responsive interface
Exportable reports with customizable fields
Defining our users, requirements, and pain points allowed us to develop journey maps:
While we were defining our users, we have learned an important statement that guided our direction of the product: Some of the personas wait for others to fill in data in order to continue, also, not everyone uses all tools. I believed it was important to understand each user's role in an entire system, which led me to advocate for a service blueprint in our design.
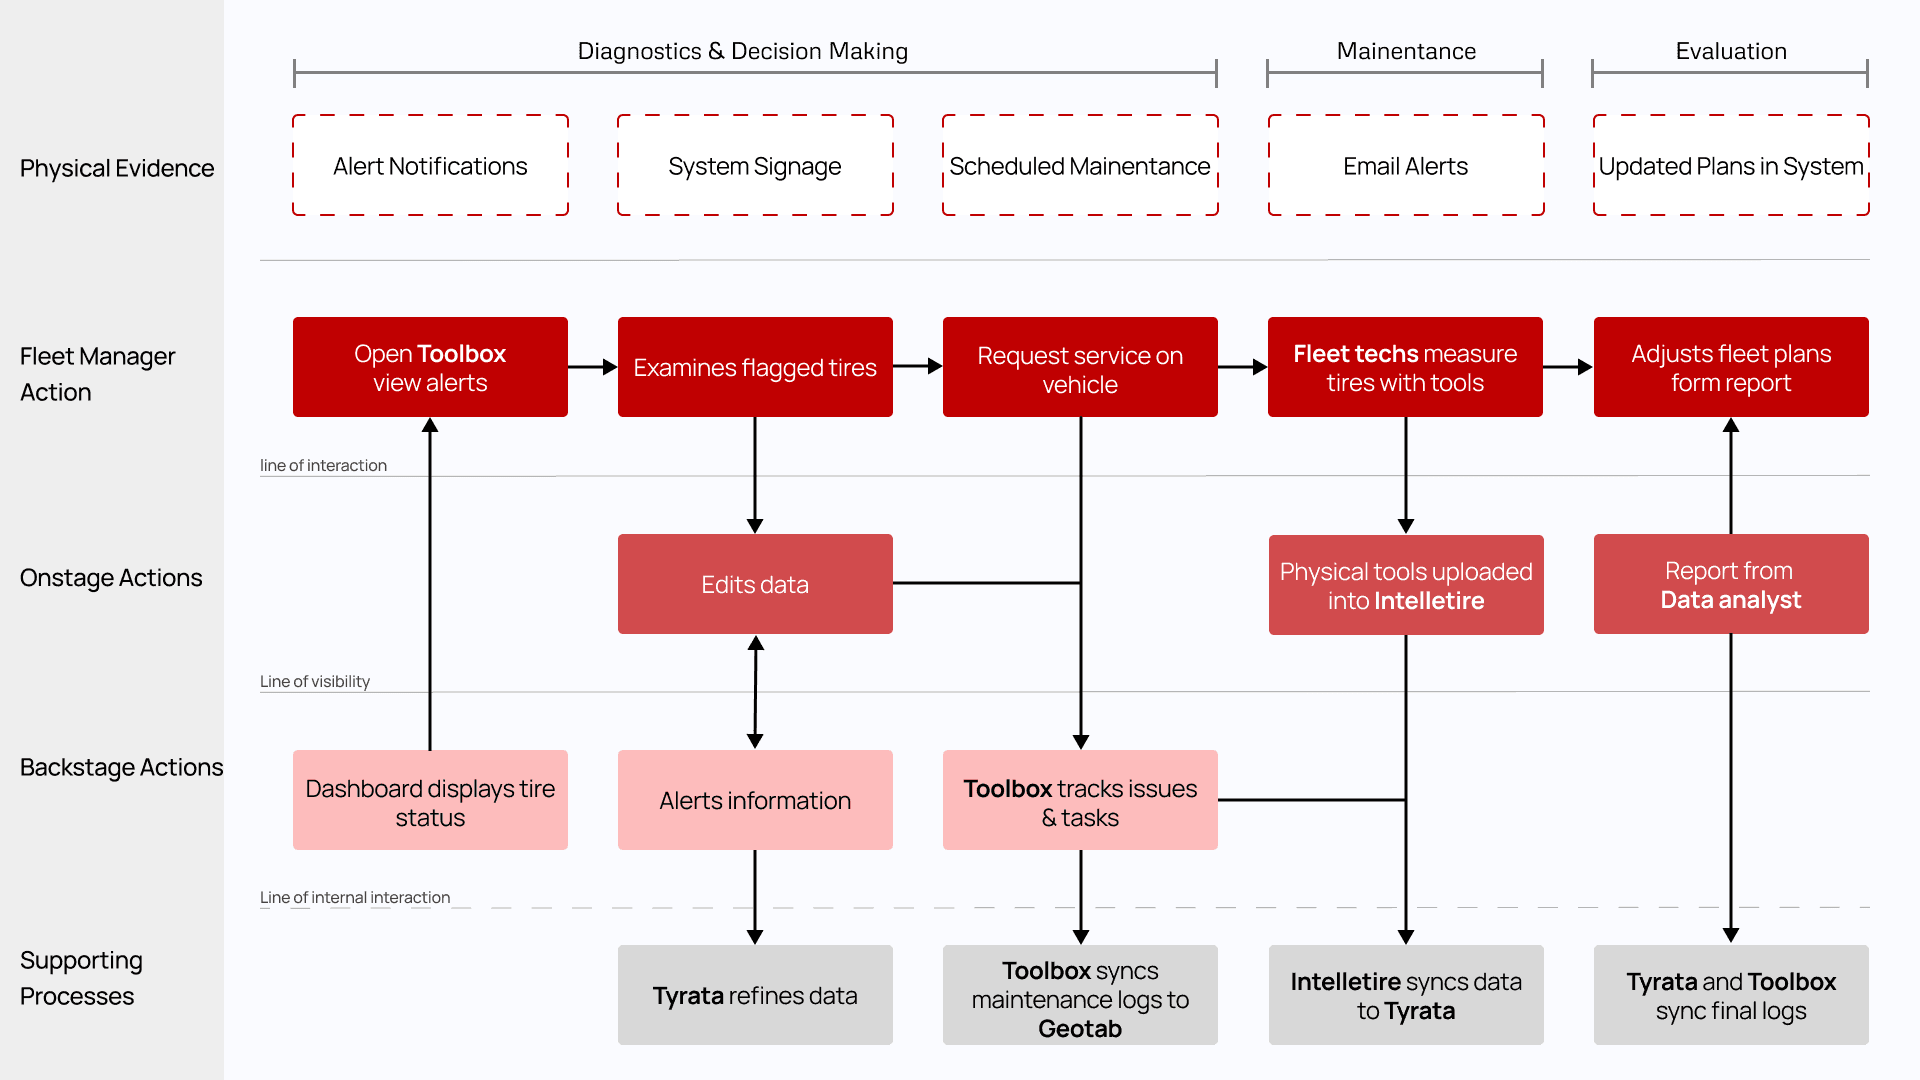
Analyzing our service blueprint answered our question: Do different personas have different needs that aren't related to the other?
Development
Process
Created low-fidelity wireframes based on storyboarding use cases
Prototyped two solutions with Figma including responsive views and animations
Applied accessibility best practices from WCAG 2.1
Iterated designs using feedback from stakeholders and test participants
Design Highlights
Custom dashboards with filterable alerts
Action cards with clear CTAs
Role-based view toggle (Manager, Technician)
Animation for onboarding and progressive disclosure of alerts
Deliver
Usability Testing
Conducted remote task-based usability testing with 7 participants
Tasks included locating tire issues, exporting reports, and scheduling inspections
Results
40% Faster task completion on redesigned dashboard
95% Improved comprehension of tire scores with new labeling
Reduced unnecessary clicks by consolidating navigation and metrics
70+ Accessibility improvements from the original tool
Outcomes
Delivered design specs to Bridgestone's Tirematics team for integration
Sparked internal conversations about expanding mobile-first tools
Centralized 3 tools into a single cohesive system mockup

Reflection
This project helped me become a stronger systems thinker. I started unsure and relied on consistent interviews and self-learning to catch up quickly. Through user conversations, I learned to listen for underlying needs—not just surface complaints.
If I could go back, I’d:
Prioritize open and continuous communication within the design team to ensure shared understanding of our process stage
Set expectations early around iterative design, so everyone feels aligned and empowered to contribute at the right time